How many theatrical films does the average American go to in a year?
The simple answer is four, and that number has remained essentially unchanged since 1964. You have probably read about how the theatrical movie industry has been hurt by the gradual shift of B-movie entertainment from drive-ins and grindhouses to VHS in the 70s, and then by the proliferation of affordable high-quality home theaters in recent years. That didn't really happen. Whatever business the theaters lost to home entertainment they gained right back by the overall increased interest in films. People went to five movies per year in 2004, as they did in 1964, 1974, 1984, and 1994.
You may have noticed that I didn't mention anything before 1964. That's because the 1946-64 era has to be considered separately. It was not a period of stability like the past forty years, but an era of revolutionary change in the entertainment industry. In 1946, the first full year after WW2 ended, Americans went to 34 theatrical movies per capita. That's not a typo. It's really 34, not 3.4. People went to eight times as many movies as they go to today - and there were only half as many theaters. There were 250,000 tickets sold for every screen available in 1946, compared to about 30,000 in 2011. It was a helluva business to be in back then.
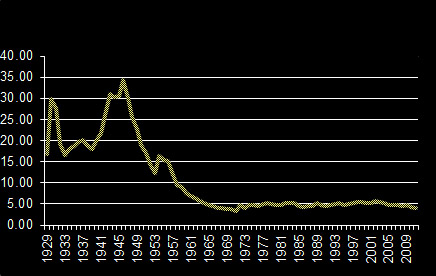
From the 1946 high water mark until 1964, however, the number of films per capita plummeted from 34 to 5. In those 18 short years, the movie industry all but disappeared, losing 80% of its market, as ticket sales dropped from about five billion per year to less than one billion. (It's about 1.2 billion today, thanks to population growth.) The following chart demonstrates the dramatic change in the industry during that time.
That period of post-war prosperity should have been a happy one for the industry, but at the same time that people found their pockets to be full of money, they also discovered a new kind of magic flickering box in their living rooms. That box hypnotized them. It offered them other forms of entertainment as an alternate to movies. It came to them live. It even offered them movies in their own homes. Under attack, movies had no significant weapons with which to fight back. They could tinker with bigger screens, wider screens, 3-D, and sound systems, but they could not change the most important element - their product. Because the notorious and restrictive Hays Code was still in effect until 1967, the studios could not juice up the sex and violence to make theatrical entertainment any different from TV entertainment. The results were disastrous for the cinema industry. Between 1946 and 1964, total ticket sales showed a year-on-year decline every single year except 1954, despite constant population growth.
The film box office statistics since the inception of talking pictures.
| Year | price/ ticket |
U.S. population (millions) |
# screens | tickets sold (millions) |
tickets per capita |
tickets per screen |
| 1929 | $0.35 | 122 | 23,344 | 2,057 | 17 | 88,123 |
| 1930 | $0.20 | 123 | 23,000 | 3,660 | 30 | 159,130 |
| 1931 | $0.21 | 124 | 21,993 | 3,424 | 28 | 155,677 |
| 1932 | $0.22 | 125 | 18,715 | 2,395 | 19 | 127,997 |
| 1933 | $0.23 | 126 | 18,553 | 2,096 | 17 | 112,955 |
| 1934 | $0.23 | 126 | 16,885 | 2,252 | 18 | 133,383 |
| 1935 | $0.24 | 127 | 15,273 | 2,358 | 19 | 154,412 |
| 1936 | $0.25 | 128 | 15,858 | 2,504 | 20 | 157,901 |
| 1937 | $0.26 | 129 | 18,192 | 2,600 | 20 | 142,920 |
| 1938 | $0.27 | 130 | 18,192 | 2,456 | 19 | 134,980 |
| 1939 | $0.28 | 131 | 17,929 | 2,354 | 18 | 131,272 |
| 1940 | $0.28 | 132 | 19,042 | 2,625 | 20 | 137,853 |
| 1941 | $0.28 | 133 | 19,750 | 2,889 | 22 | 146,293 |
| 1942 | $0.29 | 135 | 20,380 | 3,524 | 26 | 172,921 |
| 1943 | $0.30 | 137 | 20,293 | 4,250 | 31 | 209,432 |
| 1944 | $0.32 | 138 | 20,375 | 4,191 | 30 | 205,675 |
| 1945 | $0.34 | 140 | 20,457 | 4,265 | 30 | 208,472 |
| 1946 | $0.35 | 141 | 19,019 | 4,834 | 34 | 254,182 |
| 1947 | $0.37 | 144 | 18,607 | 4,308 | 30 | 231,532 |
| 1948 | $0.40 | 147 | 18,395 | 3,765 | 26 | 204,675 |
| 1949 | $0.43 | 149 | 18,570 | 3,374 | 23 | 181,713 |
| 1950 | $0.48 | 152 | 19,106 | 2,867 | 19 | 150,040 |
| 1951 | $0.50 | 155 | 18,980 | 2,620 | 17 | 138,040 |
| 1952 | $0.55 | 158 | 18,623 | 2,265 | 14 | 121,648 |
| 1953 | $0.60 | 160 | 17,965 | 1,978 | 12 | 110,122 |
| 1954 | $0.46 | 163 | 19,101 | 2,670 | 16 | 139,760 |
| 1955 | $0.52 | 166 | 19,200 | 2,550 | 15 | 132,813 |
| 1956 | $0.55 | 169 | 19,003 | 2,535 | 15 | 133,376 |
| 1957 | $0.56 | 172 | 19,003 | 2,011 | 12 | 105,810 |
| 1958 | $0.60 | 175 | 16,000 | 1,653 | 9 | 103,333 |
| 1959 | $0.60 | 178 | 16,103 | 1,597 | 9 | 99,153 |
| 1960 | $0.69 | 181 | 16,999 | 1,378 | 8 | 81,079 |
| 1961 | $0.74 | 184 | 21,000 | 1,245 | 7 | 59,266 |
| 1962 | $0.75 | 187 | 21,000 | 1,204 | 6 | 57,333 |
| 1963 | $0.85 | 189 | 12,800 | 1,064 | 6 | 83,088 |
| 1964 | $0.94 | 192 | 13,750 | 971 | 5 | 70,638 |
| 1965 | $1.02 | 194 | 14,000 | 909 | 5 | 64,916 |
| 1966 | $1.10 | 197 | 14,350 | 876 | 4 | 61,071 |
| 1967 | $1.21 | 199 | 13,490 | 817 | 4 | 60,590 |
| 1968 | $1.31 | 201 | 13,120 | 798 | 4 | 60,801 |
| 1969 | $1.42 | 203 | 13,500 | 774 | 4 | 57,329 |
| 1970 | $1.55 | 205 | 13,750 | 750 | 4 | 54,522 |
| 1971 | $1.65 | 208 | 14,000 | 709 | 3 | 50,649 |
| 1972 | $1.70 | 210 | 14,400 | 967 | 5 | 67,157 |
| 1973 | $1.77 | 212 | 14,400 | 861 | 4 | 59,793 |
| 1974 | $1.87 | 214 | 14,400 | 1,021 | 5 | 70,893 |
| 1975 | $2.05 | 216 | 15,000 | 1,032 | 5 | 68,780 |
| 1976 | $2.13 | 218 | 15,800 | 956 | 4 | 60,498 |
| 1977 | $2.23 | 220 | 16,050 | 1,064 | 5 | 66,273 |
| 1978 | $2.34 | 223 | 16,250 | 1,134 | 5 | 69,770 |
| 1979 | $2.51 | 225 | 16,900 | 1,118 | 5 | 66,150 |
| 1980 | $2.60 | 227 | 17,600 | 1,057 | 5 | 60,074 |
| 1981 | $2.78 | 229 | 18,056 | 1,067 | 5 | 59,089 |
| 1982 | $2.94 | 232 | 18,000 | 1,174 | 5 | 65,231 |
| 1983 | $3.15 | 234 | 18,900 | 1,196 | 5 | 63,257 |
| 1984 | $3.36 | 236 | 20,200 | 1,200 | 5 | 59,391 |
| 1985 | $3.55 | 238 | 21,150 | 1,056 | 4 | 49,932 |
| 1986 | $3.71 | 240 | 22,750 | 1,018 | 4 | 44,762 |
| 1987 | $3.91 | 242 | 23,550 | 1,088 | 4 | 46,188 |
| 1988 | $4.11 | 244 | 23,250 | 1,085 | 4 | 46,653 |
| 1989 | $3.97 | 247 | 21,150 | 1,268 | 5 | 59,941 |
| 1990 | $4.23 | 249 | 23,700 | 1,187 | 5 | 50,094 |
| 1991 | $4.21 | 252 | 24,575 | 1,141 | 5 | 46,423 |
| 1992 | $4.15 | 255 | 25,100 | 1,174 | 5 | 46,762 |
| 1993 | $4.14 | 258 | 25,750 | 1,245 | 5 | 48,347 |
| 1994 | $4.08 | 261 | 25,689 | 1,324 | 5 | 51,521 |
| 1995 | $4.35 | 264 | 27,843 | 1,262 | 5 | 45,328 |
| 1996 | $4.42 | 267 | 29,731 | 1,337 | 5 | 44,973 |
| 1997 | $4.59 | 270 | 31,865 | 1,388 | 5 | 43,552 |
| 1998 | $4.69 | 273 | 34,168 | 1,482 | 5 | 43,370 |
| 1999 | $5.06 | 276 | 37,131 | 1,472 | 5 | 39,652 |
| 2000 | $5.39 | 281 | 36,280 | 1,423 | 5 | 39,223 |
| 2001 | $5.65 | 284 | 35,173 | 1,488 | 5 | 42,319 |
| 2002 | $5.80 | 287 | 35,836 | 1,641 | 6 | 45,803 |
| 2003 | $6.03 | 290 | 35,995 | 1,574 | 5 | 43,723 |
| 2004 | $6.21 | 293 | 36,652 | 1,535 | 5 | 41,870 |
| 2005 | $6.40 | 296 | 37,740 | 1,381 | 5 | 36,591 |
| 2006 | $6.58 | 301 | 38,415 | 1,400 | 5 | 36,432 |
| 2007 | $6.88 | 303 | 38,794 | 1,404 | 5 | 36,182 |
| 2008 |
$7.18 |
305 |
39,567 |
1.365 |
4 |
34,496 |
| 2009 |
$7.46 |
308 |
39,233 |
1,420 |
5 |
36,197 |
| 2010 |
$7.95 |
311 |
39,238 |
1,329 |
4 |
33,859 |
| 2011 |
$7.96 |
313 |
40,194 |
1,242 |
4 |
30,909 |